An underrated functionality in some modern IDEs, such as vscode, enables us to write code in the local machine and run and debug them in a remote device in real time. vscode client/server architecture enables this functionality - called “Dev Containers”.
An excellent official article on the vscode website explains the setup for the Go debugging. In this post, I will share my experience tailored to the vscode IDE and Docker desktop. All the sample code is available here.
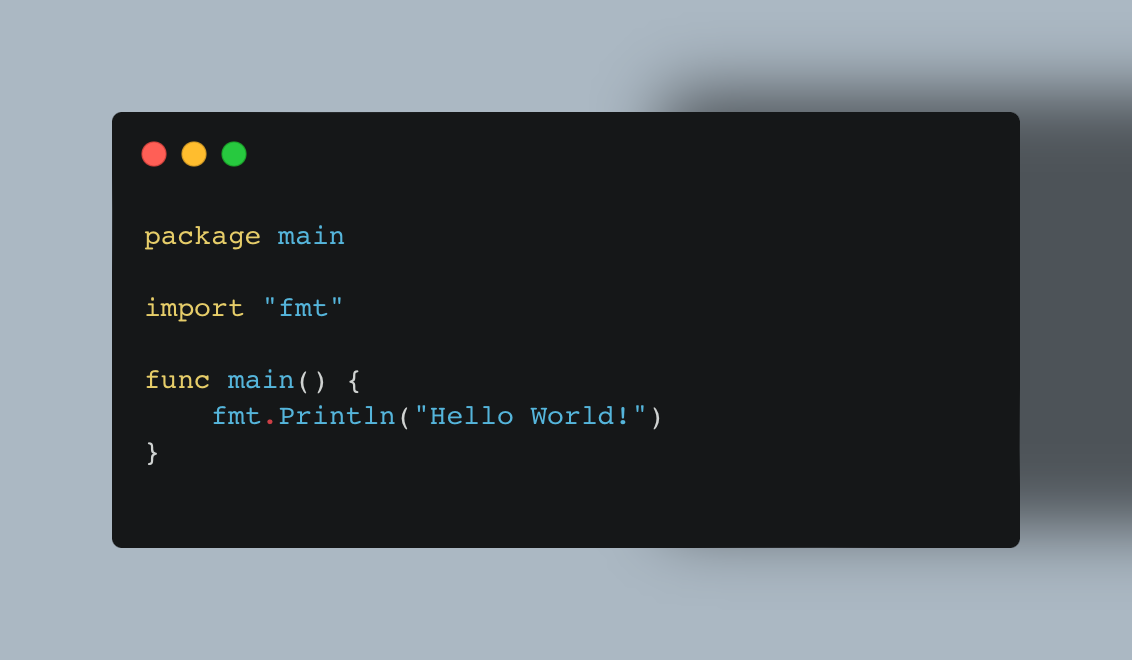
Consider the following simple application. In a real-world scenario, this might be an HTTP server that listens to port 9000.
While you are here, right-click on line 6, and click “Add Inline Breakpoint” (Shift + F9).
I explain two types of configuration: Launch mode, and Attach mode.
In the Launch mode, vscode builds and runs the app in the debug mode. Subsequently, it attaches to the process. In the Attach mode, the IDE attaches to a running process. In our scenario, the application is running on a remote machine.
Setting up the Dev Container
First thing we need to do is to setup an a remote environment for our application to build and run from. In order to use Dev Containers, we need to create these files in the .devcontainer folder.
The first file to create in the above folder is devcontainer.json. This files explains the specification of our remote development container. One thing to highlight here is that we have opened port 2345 as the delve server uses this port for remote debugging. For more info about this file, please refer to this document.
// For format details, see https://aka.ms/vscode-remote/devcontainer.json or this file's README at:
// https://github.com/microsoft/vscode-dev-containers/tree/v0.195.0/containers/go
{
	"name": "Go",
	"build": {
		"dockerfile": "Dockerfile",
		"args": {
			// Update the VARIANT arg to pick a version of Go: 1, 1.16, 1.17
			// Append -bullseye or -buster to pin to an OS version.
			// Use -bullseye variants on local arm64/Apple Silicon.
			"VARIANT": "1.17-bullseye",
			// Options
			"NODE_VERSION": "lts/*"
		}
	},
	"runArgs": [ "--cap-add=SYS_PTRACE", "--security-opt", "seccomp=unconfined" ],

	// Configure tool-specific properties.
	"customizations": {
		// Configure properties specific to VS Code.
		"vscode": {
			// Set *default* container specific settings.json values on container create.
			"settings": {
				"go.toolsManagement.checkForUpdates": "local",
				"go.useLanguageServer": true,
				"go.gopath": "/go",
				"go.goroot": "/usr/local/go"
			},

			// Add the IDs of extensions you want installed when the container is created.
			"extensions": [
				"golang.Go"
			]
		}
	},

	// Use 'forwardPorts' to make a list of ports inside the container available locally.
	"forwardPorts": [9000,2345],

	// Use 'portsAttributes' to set default properties for specific forwarded ports. More info: https://code.visualstudio.com/docs/remote/devcontainerjson-reference.
	"portsAttributes": {
		"9000": {
			"label": "http port",
			"onAutoForward": "notify"
		},
		"2345": {
			"label": "debug port",
			"onAutoForward": "notify"
		}
	},

	// Use 'otherPortsAttributes' to configure any ports that aren't configured using 'portsAttributes'.
	// "otherPortsAttributes": {
	// 		"onAutoForward": "silent"
	// },

	// Use 'postCreateCommand' to run commands after the container is created.
	"postCreateCommand": "go version",

	// Uncomment to connect as a non-root user. More info: https://aka.ms/vscode-remote/containers/non-root.
	"remoteUser": "vscode"
}
The second file to create is a Dockerfile specificying the docker dev environment. This is a Dockerfile with all the necessary tools for running and debugging a go application and is referenced in the devcontainer.json.
ARG VARIANT=1-bullseye
FROM mcr.microsoft.com/devcontainers/go:0-${VARIANT}

# [Choice] Node.js version: lts/*, 16, 14, 12, 10
ARG NODE_VERSION="lts/*"
RUN if [ "${NODE_VERSION}" != "none" ]; then su vscode -c ". /usr/local/share/nvm/nvm.sh && nvm install ${NODE_VERSION} 2>&1"; fi
Note: There is a collection of these two files available for your reference here.
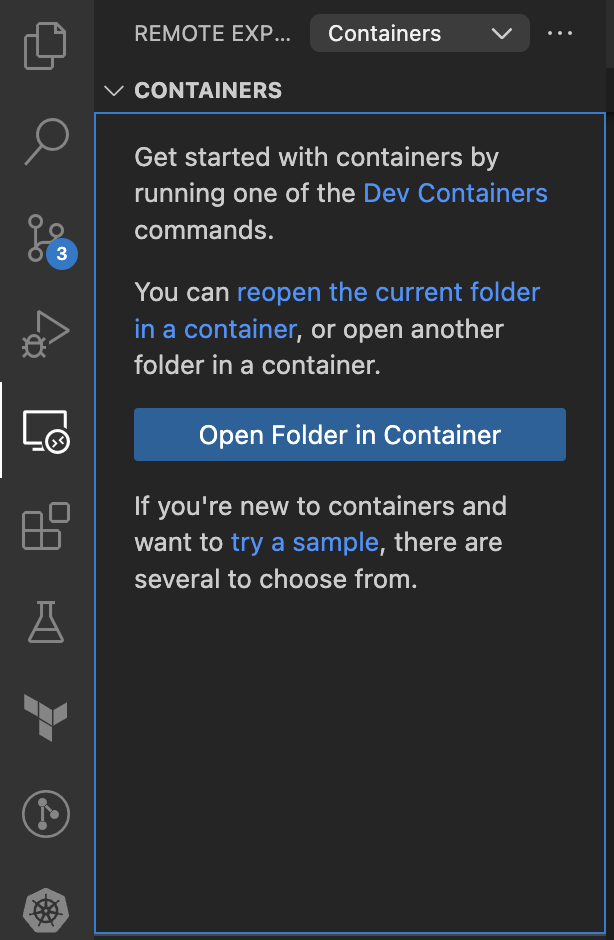
Next, navigate to the “Remote Explorer” in vscode and click on “reopen the current folder in a container.”
The IDE will build a container based on the .devcontainer folder specification and clone the code there. From this point, the code is built and run in the container (remotely) while it is editable on your local machine. In other words, you may edit the code on a device that does not have any go runtime installed (iPad).
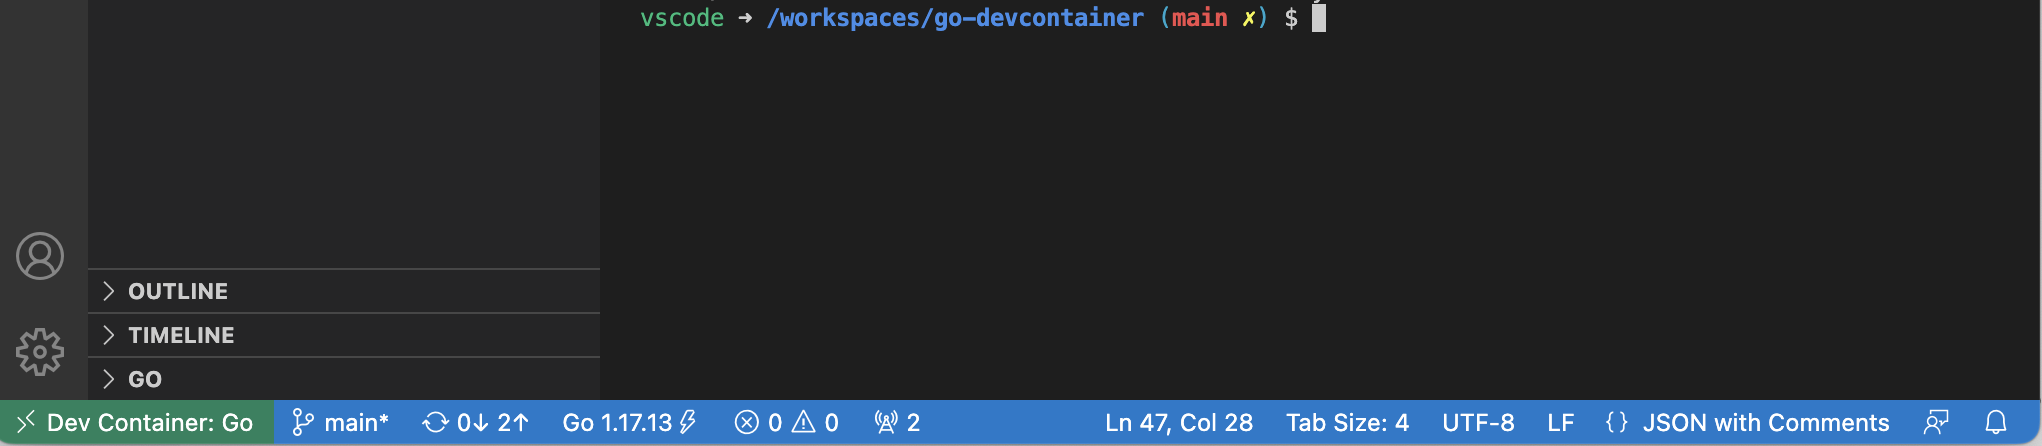
In the above image, you can see on the green bottom left section that the code is running in a Dev Container.
Launch Configuration
While the code now is running in a remote container, we still need to configure vscode to let it know how to debug the application remotely. To do so, create the launch config file .vscode/launch.json with the below content:
{
    "version": "0.2.0",
    "configurations": [
        {
            "name": "Launch Remote",
            "type": "go",
            "request": "launch",
            "mode": "debug",
            "program": "${workspaceFolder}"
        }
    ]
}
typeis set togoas this is the language we are trying to debug.requestattribute is set tolaunch, andmodeis set todebug.programattribute points to the environment variable for the application folder we are trying to debug.
Now navigate to the “Run and Debug” pane, and hit “Start Debugging.” Since you already have a breakpoint on line 6, your program should stop for your following command on this line. You can step in/out or continue the execution of the application using the run/debug panel.
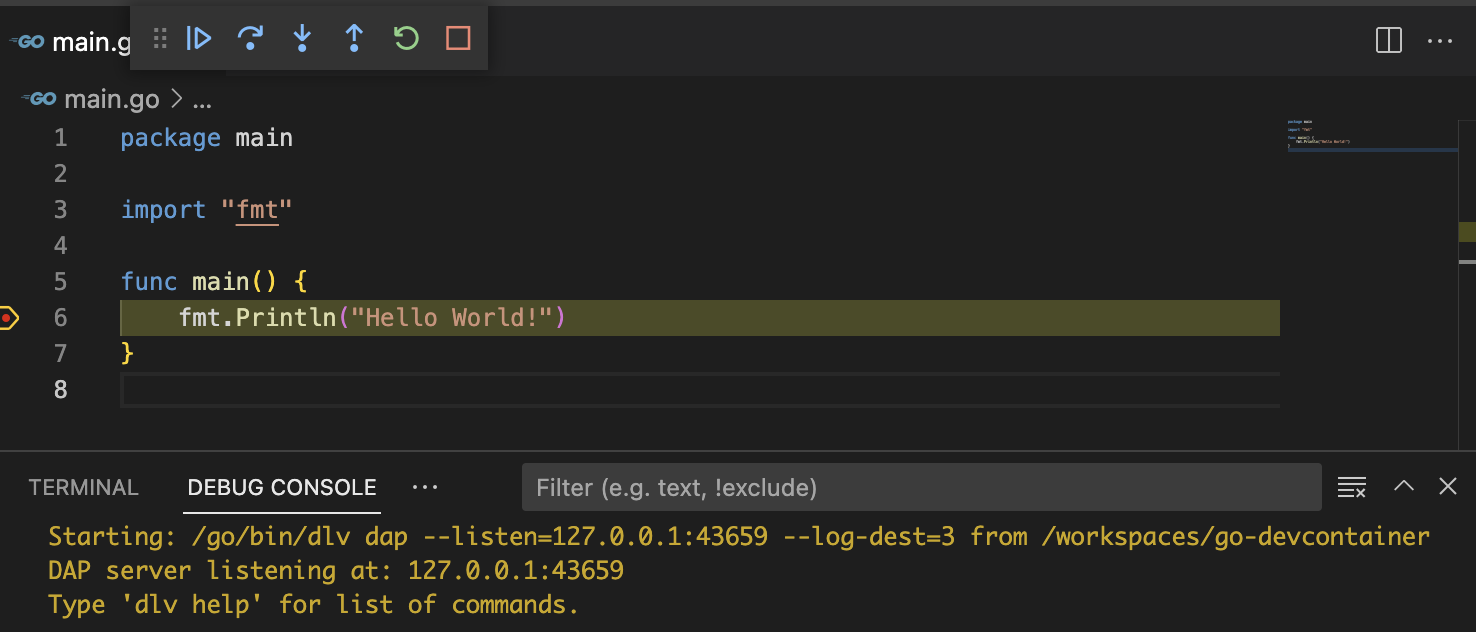
Something cool to highlight is that in the Debug Console you can see that vscode already started a debug server using delve in the remote server.
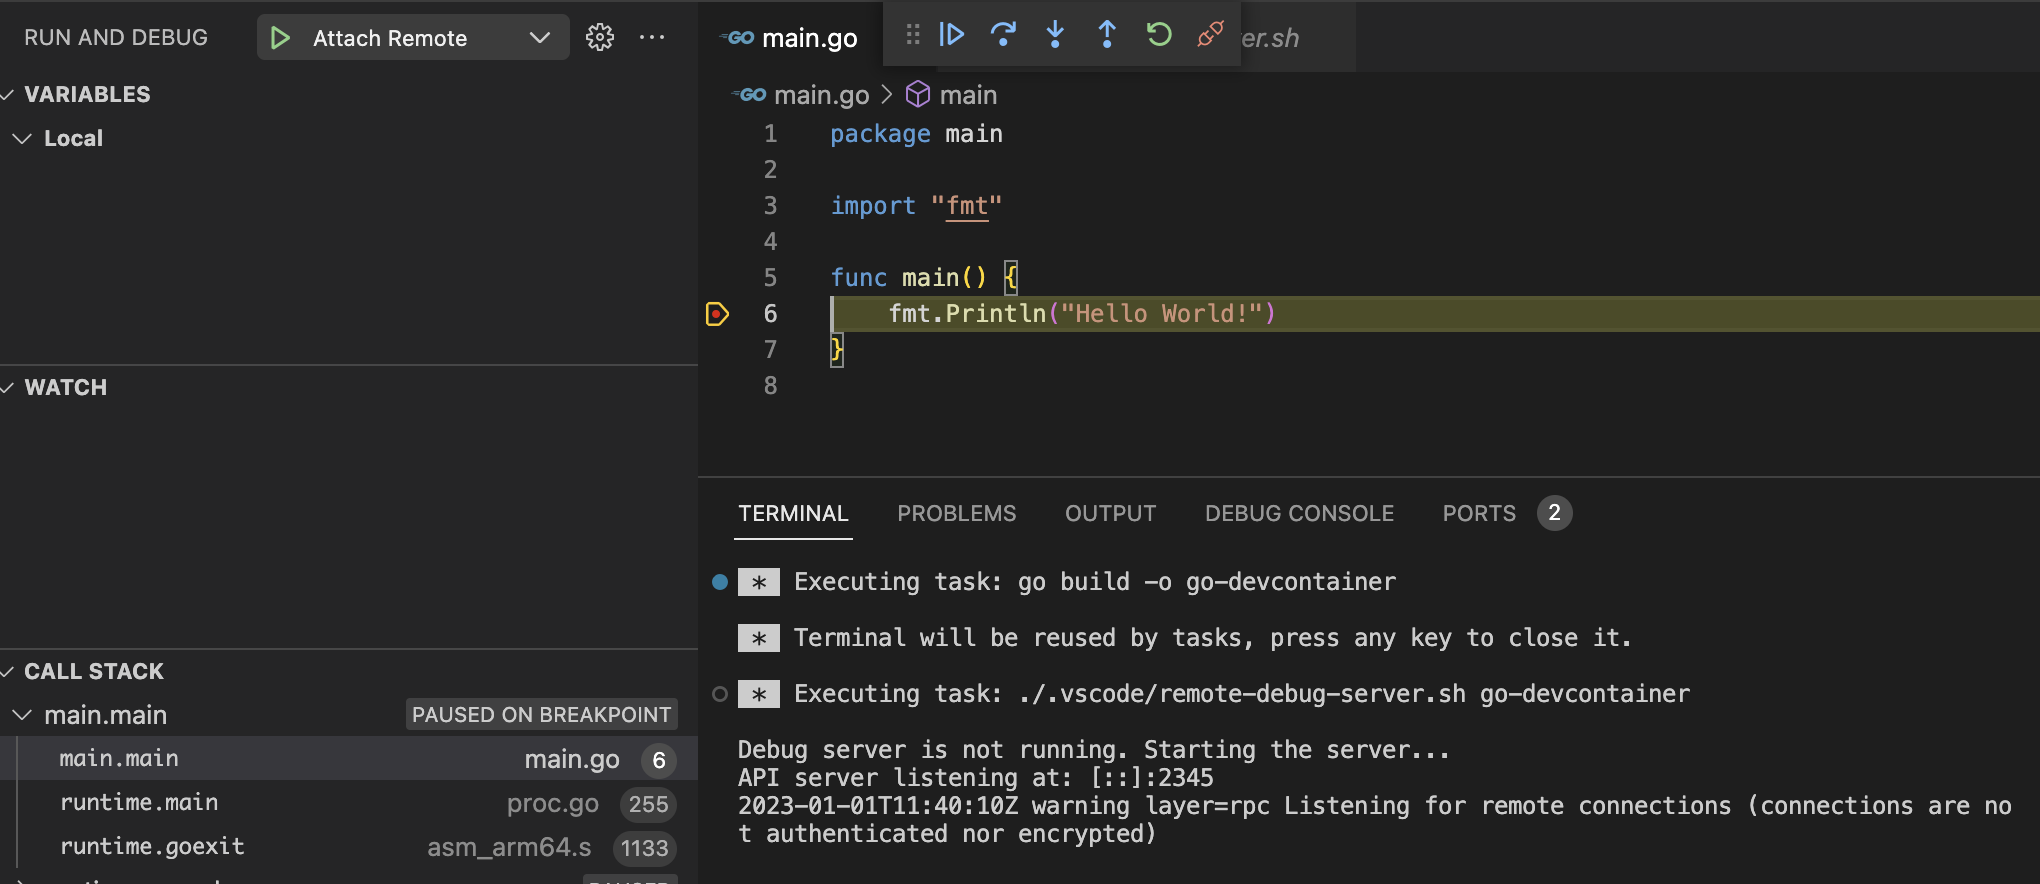
Attach Configuration
In the attach mode, the IDE debugs a running application. In order to make this happen we rely on delve server to either attach to the app using it’s PID, or execute the app when the debug session is started. First we need to update the launch.json
{
    "version": "0.2.0",
    "configurations": [
        {
            "name": "Attach Remote",
            "type": "go",
            "request": "attach",
            "mode": "remote",
            "remotePath": "${workspaceFolder}",
            "port": 2345,
            "host": "127.0.0.1",
            "cwd": "${workspaceFolder}",
            "trace": "verbose"
        }
    ]
}
typeis set togoas this is the language we are trying to debug.requestattribute is set toattach, andmodeis set toremote. This will tell the IDE that the application is not in the local machine.hostandportattribute points to the remote environment where delve server is running.
We can utilise the .vscode/task.json to automate these steps. We have a task build and launch debug server that depends on build tasks. It means if we run the former task, vscode will:
- Build the application into an executable on the remote server,
- Start or Restart the Delve server and using the server to run the executable
{
	"version": "2.0.0",
	"echoCommand": true,
	"options": {
		"cwd": "${workspaceRoot}",
		"env": {
            "GOPATH": "/go"
        }
	},
	"tasks": [
		{
			"label": "build",
            "command": "go",
            "type": "shell",
			"args": ["build", "-o", "${workspaceFolderBasename}"]
		},
        {
			"label": "build and launch debug server",
            "command": "./.vscode/remote-debug-server.sh",
            "type": "shell",
            "args": ["${workspaceFolderBasename}"],
            "dependsOn": ["build"]
		}
	]
}
The small shell script to start or restart the delve server:
dlvpid=`pgrep -x dlv`
if [ "$dlvpid" != "" ];then
    echo "Debug server is running. Restrating the server..."
    kill 15 $dlvpid
    sleep 2
    dlv --listen=:2345 --headless=true --api-version=2 exec ./$1
else
    echo "Debug server is not running. Starting the server..."
    dlv --listen=:2345 --headless=true --api-version=2 exec ./$1
fi
Run the Build and launch debug server (Command+Shift+P > Tasks: Run Task). Now that the debug server is running, you can use the Run and Debug panel in vscode to attach to the remote server and start the debugging session.
Here is the sample code used in this post.